




- Published on: 2026-10-09 10:12:05
Top-Down Analysis Approach: A Practical Trading Guide

A sharp move on a short-term chart can look like an opportunity until the broader market gives it context. The top-down analysis approach starts with that bigger picture, then narrows your focus toward a possible trade. It helps organize what you observe, but it is not a signal or a prediction of future prices.
If fast chart movements feel noisy, you’re not alone. The term can describe two related but distinct processes: moving through higher and lower chart timeframes, or narrowing research from economic conditions to sectors and individual markets or companies. Knowing which process you’re using makes your analysis clearer and more consistent.
This guide explains both meanings, then walks through a practical chart-based workflow from broad context to a potential entry. You’ll learn how to form a trade plan, define risk, and review your decisions using a consistent process rather than judging them by a single outcome. Analysis can’t remove uncertainty or guarantee results, but a structured approach can make each decision more deliberate and easier to review.
Key Takeaways
- Separate the two meanings of top-down analysis: moving across chart timeframes and narrowing research from the economy to a sector, market, or company.
- Give each timeframe a role: use broader charts for context, intermediate charts to assess a setup, and closer views to examine potential execution.
- Treat aligned, mixed, or conflicting timeframe readings as context for a cautious decision, not as a requirement for every chart to agree.
- Build a repeatable top-down analysis approach by choosing a trading horizon, reviewing context, marking levels, assessing a setup, defining risk, and recording your reasoning.
- Use a prepare, analyze, document, and review routine to assess your process over time, while remembering that analysis cannot predict outcomes or remove risk.
What Does the Top-Down Analysis Approach Mean in Trading?
The top-down analysis approach assesses a market from a broad view before narrowing toward a specific trading decision. It organizes information into layers so you can judge whether a possible setup fits its wider context. It doesn’t predict what price will do next or confirm that a trade will succeed.
The phrase can refer to two different workflows. Traders often use it to describe moving from higher-timeframe charts to lower-timeframe charts. Investors may use it for research that starts with the economy and narrows through sectors to individual companies. Both begin broadly, but the evidence, questions, and decision horizons differ. This guide focuses on chart-based trading while recognizing that economic and fundamental conditions can shape market context.
Top-down chart analysis versus top-down fundamental analysis
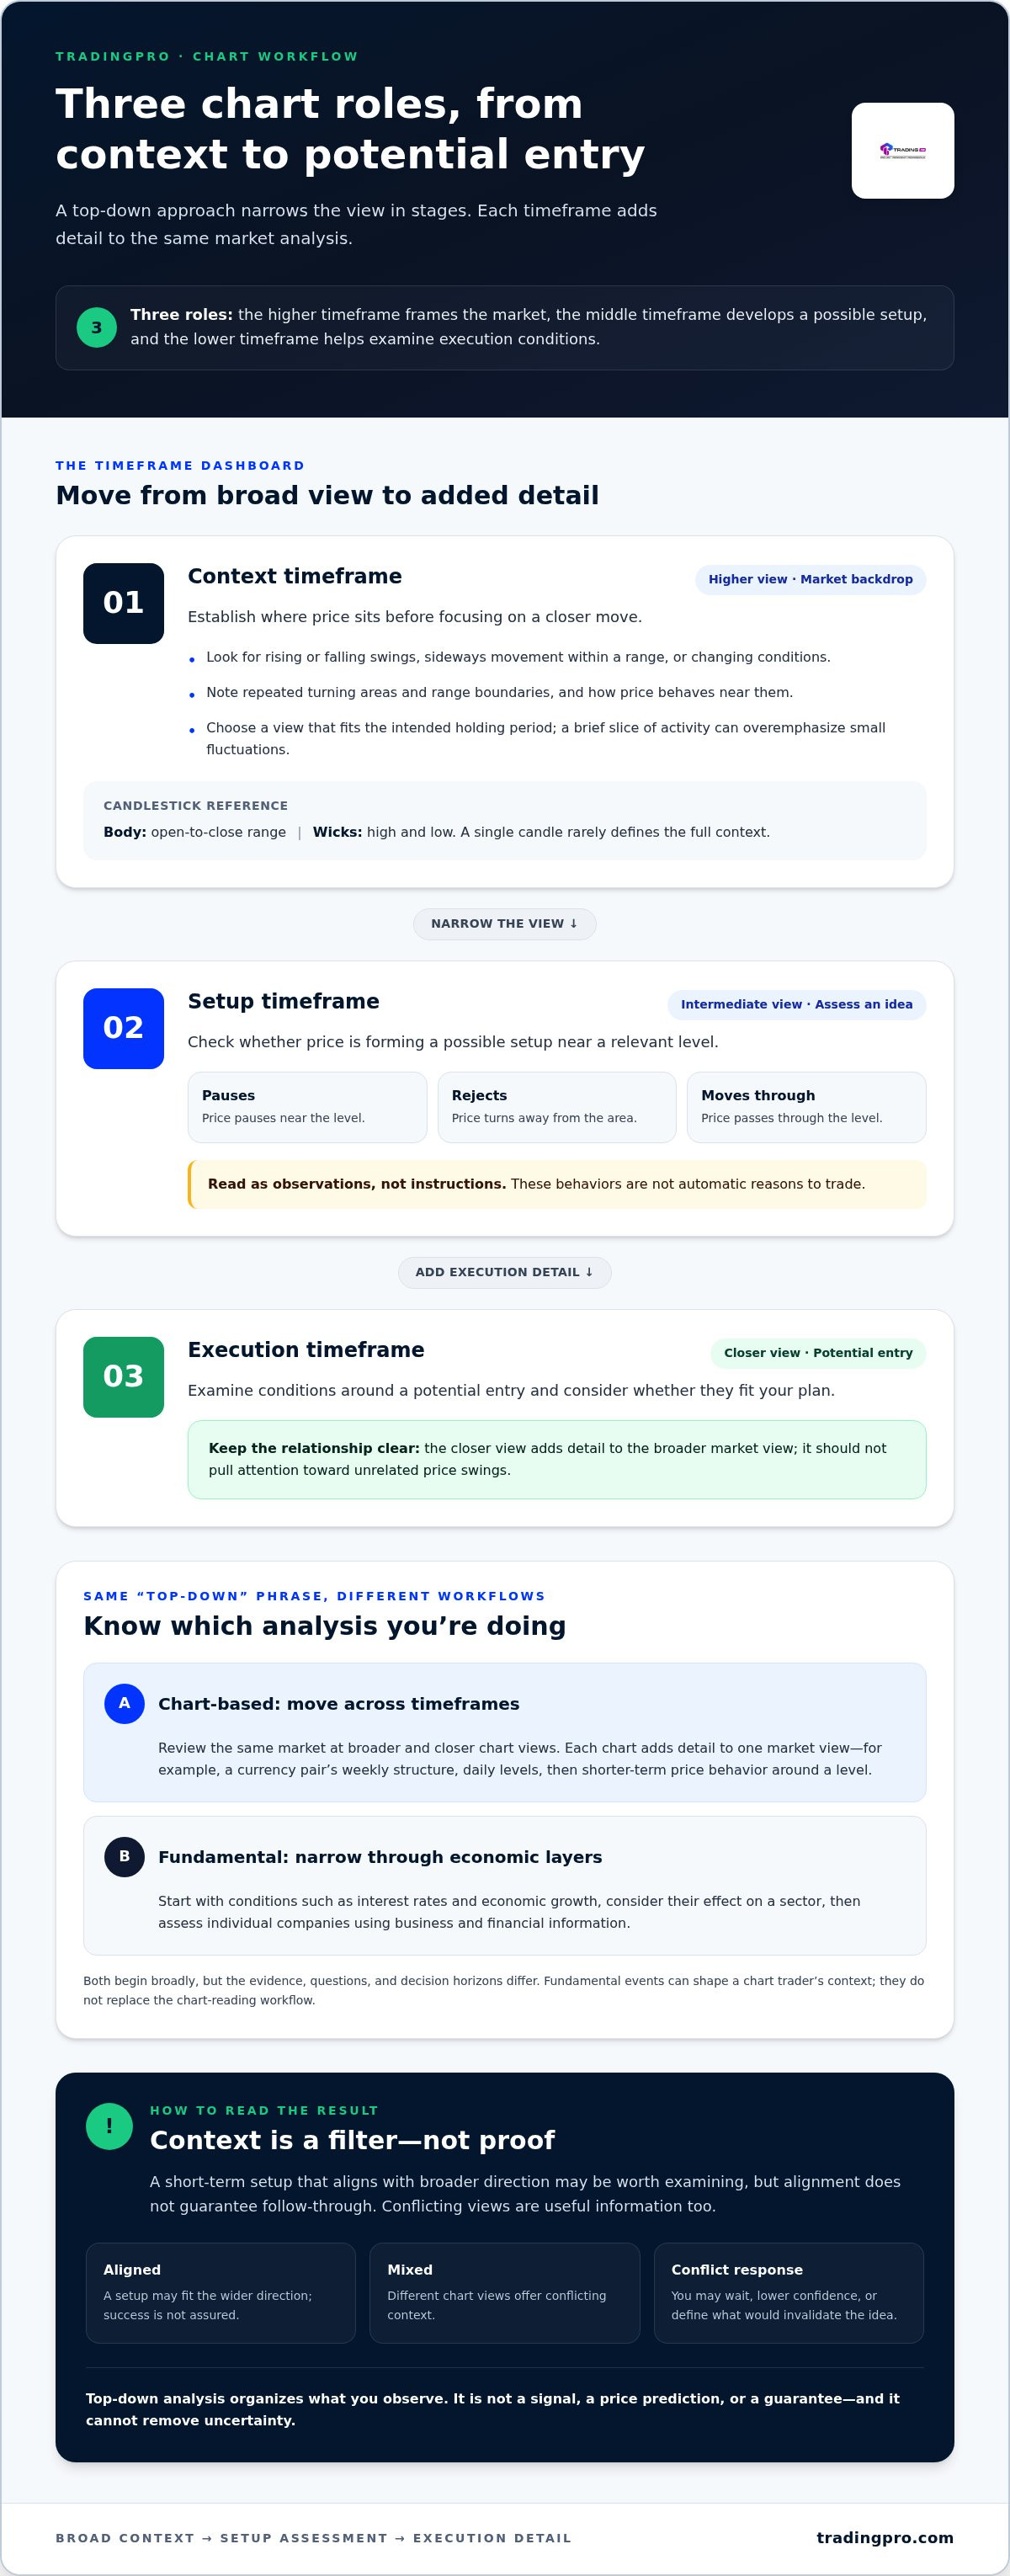
Chart-based analysis moves across timeframes. A trader might review a currency pair’s weekly chart to understand its broad structure, check a daily chart for nearby levels, then use a shorter chart to assess how price behaves around one of those levels. Each chart adds detail to the same market view. The trader is not switching from one type of research to another.
Fundamental analysis moves across economic layers. An investor might consider how interest rates and economic growth affect a sector, then compare companies within that sector using business and financial information. For example, someone researching an energy company could first assess the wider economic and sector backdrop, then examine that company’s position. This is different from choosing a chart timeframe for a trade. The general distinction between these approaches is outlined in Top-down and bottom-up approaches.
The difference matters because the timeframe changes the question. A short-horizon trader may focus on recent price behavior and nearby levels, while an investor may assess conditions that could influence a company over a longer period. Fundamental events can still affect a chart trader’s context, but they don’t replace the chart-reading workflow.
Why traders start with the bigger picture
A brief price move can look dramatic on a close-up chart but minor against a broader trend or established range. Starting with the wider chart gives you a reference point: you can see where price sits, identify areas where it has reacted before, and decide whether a lower-timeframe pattern deserves attention.
Use that context as a filter, not proof. A short-term setup that aligns with a broader direction may be worth examining, but alignment doesn’t guarantee follow-through. If the wider and closer charts tell different stories, that conflict is useful information too. It may lead you to wait, lower your confidence in the setup, or define what would invalidate your idea.
For readers building their wider market foundations, the Forex Trading for Beginners Guide: Master the Markets in 2026 connects basic forex concepts with the decisions traders face. Next, give each chart timeframe a clear role so broader context informs your analysis without dictating the outcome.
How the Top-Down Analysis Approach Moves Across Timeframes
Think in roles, not fixed chart intervals. A context timeframe frames the market, a setup timeframe helps you assess a possible opportunity, and an execution timeframe lets you examine conditions around a potential entry. In brief: the higher timeframe sets the backdrop, the middle timeframe develops the idea, and the lower timeframe tests whether execution conditions fit your plan.
Choose charts that suit your intended holding period instead of copying a standard combination. A trader planning to hold for days needs context that captures more than intraday noise. Someone focused on shorter moves may use a closer view, while still checking that it doesn’t distort the bigger picture. Each step should add relevant detail, not pull your attention toward unrelated price swings.
Start with the higher timeframe for market context
Begin by asking whether price is making a sequence of rising or falling swings, moving sideways within a range, or shifting between conditions. On a candlestick chart, each candle summarizes price movement over its selected period. Its body shows the open-to-close range, while its wicks mark the high and low. Review repeated turning areas and range boundaries, then note how price behaves near them. A single candle rarely defines the full context.
Match this view to your intended holding period. If you’re considering a trade that may last several days, a chart showing only a brief slice of activity can overemphasize small fluctuations. A very broad chart, on the other hand, may not answer a question about a short-lived setup. The goal isn’t to find a timeframe that confirms your preferred direction. It’s to establish a useful frame for the decision you’re actually considering.
Narrow down to setup and entry timeframes
Once the broader structure is clear, move to an intermediate chart and assess whether price is forming a setup near a relevant level. For example, if price approaches a previously observed range boundary, consider whether it pauses, rejects the area, or moves through it. These are observations to evaluate, not automatic instructions to trade. The Top-Down Analysis in Finance also describes the broader principle of narrowing analysis from general conditions toward specific decisions.
Use a lower timeframe only if it answers a practical execution question, such as whether price is moving erratically around your planned area or whether the setup has changed. Don’t let a small, fast move automatically overrule the broader plan. If the lower chart contradicts your original conditions, pause and reassess rather than forcing an entry. Moving averages, which smooth price data, or the Relative Strength Index (RSI), a momentum indicator, can provide optional context. Neither is required, and neither should replace a clear plan.
Keep the workflow adaptable across markets: price behavior, trading hours, and relevant context may differ, but the timeframe roles remain useful. TradingPRO offers Rookie, Micro, Pro, and Scalp accounts for different trading styles. If you’re ready to explore an account, review the registration option. Registration doesn’t replace practice, planning, or risk awareness.
How to Compare Timeframes When They Agree or Conflict
Reading several charts doesn’t mean forcing them to tell the same story. Compare what each timeframe contributes, then decide whether the evidence supports your planned setup, calls for caution, or leaves too much uncertainty. Timeframe alignment provides context for a decision, not confirmation of what price will do next.
Use these three descriptions to organize what you see. “Aligned” means the charts broadly point in a similar direction, not that every candle or indicator matches. “Mixed” means the broader context and nearer-term behavior offer different clues. “Conflicting” means the key structure or direction appears to oppose the proposed trade.
| Observation | What it may suggest | Cautious response |
|---|---|---|
| Aligned | Broader direction and the nearer setup appear compatible. | Assess the setup at a relevant level, define what would invalidate it, and follow your risk plan. Alignment alone isn’t an entry trigger. |
| Mixed | The broad view may be clear, but the intermediate or short-term chart is uncertain. | Wait for price behavior that fits your conditions, or reassess whether the setup is still valid. |
| Conflicting | The proposed trade may oppose a broader structure, or the charts may show different phases of movement. | Consider waiting, reducing planned exposure under your rules, reassessing your horizon, or skipping the setup. |
When higher and lower timeframes point in the same direction
Suppose a broader chart shows rising swing highs and lows, and a closer chart also shows upward movement. That alignment may make a potential long setup worth examining, but it doesn’t make entry automatic. Check whether the idea relates to a level you identified in advance, such as a prior area where price paused or turned. Then define an invalidation point, the price or condition that would show your setup no longer meets its premise. If you can’t explain what would change your view, alignment may be tempting you to trade without a complete plan.
When chart timeframes disagree
A short-term decline can happen inside a broader uptrend. Neither chart has to be wrong: one may show a temporary pullback while the other captures the wider structure. The difference may reflect timeframe, market phase, or uncertainty about what develops next. It doesn’t prove that a reversal is coming.
Don’t treat agreement across every chart as a requirement for useful analysis. The top-down analysis approach helps you identify where views differ and decide what that means for your specific horizon. If the mismatch matters to your setup, choose deliberately: wait for clearer conditions, reassess whether your intended holding period fits the chart you’re reading, or pass. A pause is a valid decision, not a failure to analyze. Record why the charts conflicted so you can later review whether your response followed your rules, regardless of the trade’s outcome.
How to Apply a Top-Down Analysis Approach Step by Step
A useful review turns chart observations into a plan you can explain before acting. Follow the same sequence each time, and keep your view on direction separate from decisions about exposure and risk. This process won’t predict the market or remove the possibility of loss; it makes your reasoning easier to test.
- Select your horizon. State how long you’re considering holding a position. This guides which charts are relevant and helps prevent a brief price move from redefining a longer-term idea.
- Review context. Describe the broader chart condition in plain language: trending, ranging, or unclear. Note what supports that reading rather than labeling a market bullish or bearish by instinct.
- Mark relevant levels. Identify price areas that matter to your idea, such as a prior swing high, swing low, or range boundary. Treat them as areas to observe, not guaranteed turning points.
- Assess the setup. Check whether nearer-term price behavior fits the conditions you planned to watch. If it doesn’t, record the mismatch instead of searching for a reason to enter.
- Define risk separately. Decide what would invalidate the analysis, where a stop might be placed under your rules, and how position size relates to the distance to that stop. Direction is a market view; it doesn’t determine how much exposure is appropriate.
- Record the decision. Write down the evidence, uncertainties, and next action, including a choice to wait or skip the trade.
Build a repeatable chart-review checklist
Keep the record brief but specific: name the instrument, intended holding period, higher-timeframe condition, relevant support or resistance, and evidence for the possible setup. Before noting a potential entry, state what would invalidate the idea. A clear condition, such as price failing to hold an area the setup depends on, is more useful than a vague note like “the chart looks weak.”
Hypothetical example: A trader reviewing a fictional currency pair plans to consider a position lasting several days. The broad chart appears to be ranging, and the trader marks the range’s upper boundary. On a closer chart, price approaches that area but hasn’t shown the behavior required by the trader’s plan. The decision is to wait, not assume a breakout or reversal. If the setup later forms, the trader still defines invalidation, stop placement, and position size independently. This example isn’t a current market recommendation, and no outcome is implied.
Review the decision after the trade or observation
After the trade closes, or after a watched setup passes, compare what happened with your original notes. Don’t rewrite the plan to make it look more accurate in hindsight. Track process errors, such as entering before your stated condition appeared, separately from the outcome. A trade that gained doesn’t prove the method worked; a loss doesn’t by itself show that the process was flawed.
You can explore TradingPRO’s Trade Hub as a separate resource. When you’re ready to take another step, review TradingPRO registration, while keeping practice and risk planning central to your routine.
Turn Top-Down Analysis into a Consistent Trading Routine
A repeatable routine keeps each chart review focused, even when market conditions change. The top-down analysis approach can be applied across markets, but the inputs and time horizon should fit the instrument and decision you’re considering. A forex pair, an index, and a commodity may respond to different market drivers, so don’t assume one checklist or chart setup answers every question.
Build a simple cycle:
- Prepare: Choose the market and intended holding period. Note any relevant context you plan to monitor.
- Analyze: Review the broader chart, then assess whether a setup fits your stated conditions.
- Document: Record your reasoning, uncertainty, risk plan, and decision, including a choice not to trade.
- Review: Compare your notes with what happened. Look for repeated process strengths or errors, not proof of certainty in a single outcome.
Keep the process realistic and risk-aware
Analysis is a framework for making decisions, not a guarantee of profits. A clear market view can still be wrong, and a well-documented plan can’t remove market risk. Set a pace and level of exposure that fit your personal risk tolerance. If you’re learning, focus first on understanding the process and reviewing how your decisions play out, rather than rushing to increase activity or exposure.
Indicators can offer another way to describe market conditions, but they don’t replace understanding the chart or the risks of a position. The same goes for copied trades and account tiers: they aren’t substitutes for understanding exposure or deciding what level of risk you can accept. TradingPRO’s Social Trading and Copy Trading ecosystem lets clients automate trades by copying experienced market participants. Keep your own reasons and risk limits in view when considering this feature.
Choose a next step that matches your experience
If you’re still building foundational forex knowledge, the Forex Trading for Beginners Guide: Master the Markets in 2026 offers a place to strengthen your understanding before applying a chart routine. If you’re exploring account options, TradingPRO’s Rookie Account is one of its trading account tiers. An account doesn’t replace learning, practice, or a personal risk plan.
Keep the routine manageable. Use the same prompts to prepare, analyze, document, and review, then adjust them as your market or holding period changes. Over time, your notes can help reveal whether you followed your process, where uncertainty affected your decision, and what deserves more study. That’s a more grounded measure of progress than treating any single trade as a verdict on your analysis.
If opening an account fits your next step, review TradingPRO registration.
Make Your Next Trading Decision More Deliberate
Let your next step be a process you can explain, not a prediction you feel compelled to defend. Apply the top-down analysis approach to a market you’re learning, write down what you observe, and give yourself room to wait when the picture is unclear. Consistency grows through careful practice and honest review, not certainty about what price will do.
As you build experience, keep learning and risk awareness at the center of every decision. TradingPRO offers Rookie, Micro, Pro, and Scalp account tiers, along with Social Trading and Copy Trading. These options don’t replace understanding your goals, exposure, and risk tolerance.
If opening an account fits your next step, create your TradingPRO account. Move at a pace that suits your experience, stay curious, and keep refining your process one decision at a time.
Frequently Asked Questions
What is the top-down analysis approach in trading?
The top-down analysis approach organizes market research from broad context toward a specific decision. In chart-based trading, that often means checking a wider view before assessing closer price action. In investing, it can mean starting with economic conditions and narrowing research to sectors and individual investments. For example, a trader might first identify a broad range, then assess whether a shorter-term move is relevant to their plan. This structure helps organize information, but it can’t predict outcomes or remove risk.
How do you use top-down analysis in trading?
Begin with a clear question: what market are you reviewing, and how long might you hold a position? Then describe the broader chart condition and identify which price areas could affect your idea. On a closer view, check whether the behavior you planned to watch has appeared. Before considering action, write down what would change your mind and what risk you’re prepared to accept. If those conditions aren’t clear, continue observing rather than improvising.
Which timeframes should I use for top-down analysis?
There’s no universal chart combination because timeframes need to fit both your instrument and your intended holding period. A trader studying short-lived intraday moves needs a different level of detail from someone reviewing a position they may hold for weeks. Choose a broad view, a setup view, and, if useful, a closer execution view. Keep those roles consistent while testing your process, and note when a chart adds clarity or simply adds noise.
Is top-down analysis better than bottom-up analysis?
Neither method is automatically better; each starts from a different point. Top-down research begins with wider market or economic conditions, while bottom-up analysis starts with a specific asset, company, or chart setup and then considers the wider picture. For instance, a trader may spot a chart pattern first, then check whether broader conditions affect its relevance. You can combine perspectives, but label what each contributes so one type of evidence doesn’t get mistaken for another.
What should I do when different timeframes disagree?
First check that the charts match the same instrument and a holding period that makes sense for your plan. A quick pullback on a close-up view may occur while the broader chart remains in an upward structure; both observations can be valid. If the difference changes your setup, wait, revise the idea, or stand aside. Disagreement signals uncertainty to assess, not a technical mistake or proof that price must reverse.
Can top-down analysis guarantee profitable trades?
No. Top-down analysis can help structure a decision, but it can’t guarantee a profitable outcome or prevent unexpected market moves. A planned trade can still lose, so decide in advance how much risk you’re willing to accept and don’t risk money you can’t afford to lose. Review a series of decisions to see whether you followed your rules, rather than treating one result as proof. Past performance doesn’t guarantee future results.
What is the difference between top-down trading and top-down investing?
Top-down trading usually refers to reviewing price across chart timeframes to assess market context and a possible setup. Top-down investing generally starts with broad economic conditions, then narrows research to sectors and individual investments. For example, a chart trader might compare a currency pair’s longer-term structure with nearer-term movement, while an investor might examine how economic conditions affect an industry before researching a company. The terms share a broad-to-specific logic, but the inputs and decision horizons differ.


